

Visual Representations
Managerie has developed
a method of demonstrating how learning progresses. The representations
are user friendly and do not require any special knowledge to
be understood. In essence they are health checks. They are based on the individual
perceptions within a group of one aspect of the same activity,
for example, whether there was a plan or not.

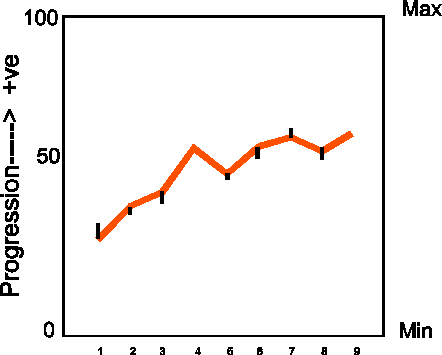
Error =% of invalid returns in sample,
shown as vertical black bars.
A score increase indicates
positive progress
A score decrease indicates
the need to address unresolved issues
This is
an example of a chart which demonstrates progress in a simple
visual form, and can be produced easily. Course participants can
see easily whether or not there has been a change in the way they
have approached a problem and can use this to help focus on key
issues.

Home Page
All products are distributed
under License
![]()
![]()


![]()